I have spent most of today and yesterday trying to simulate a basic form of erosion due to the action of water washing away at the surface of a height map. To generate convincing, earth like procedural terrains, I really believe this is a phenomenon that needs to be modeled. I devised and implemented two approaches to model this, the first involving something similar to pressure maps or heat maps, however it was too unstable to be really useful. The second method is much more simple at its core however unfortunately not as fast as my first method.
I store an array that holds 32768 (2048*16) particles, each initially placed at random across the surface of the height map. Each particle has a location, a velocity, and also a mass parameter. Each particle gains an acceleration that guides it down the height map. This is achieved by sampling the gradient underneath each particle in a process exactly the same method as that which is used to generate normal maps from height maps. Figure 1 shows the height map and Figure 2 shows the corresponding normal map that can been calculated from it. I did in fact take things one stage farther and allow the position of each particle to have a sub pixel accuracy so that the gradient can be calculated at sub pixel accuracy too using bicubic interpolation. As particles run down the height maps, it is inevitable that their motion will cease at some point as they come to rest. I detect this when the magnitude of their velocity is close to zero, at which point they are given a random location, with a bias towards high areas of the height map providing a weak model of evaporation. When a critical speed is reached for any particle then it will lift material from its position on the height map and add it to the particles mass parameter. When a particle lifts material, the height map is written to, again using bicubic interpolation, to reflect the loss of this material. Figure 3 shows a visualisation of the particle system during simulation. Particles shown in red are currently moving fast enough to lift material from the height maps surface. When a particle comes to rest and has been flagged to be moved by the evaporation process, all of the mass that it has accumulated is first deposited at its current resting point. Since the gradients are recalculated for each particle during its update, these two processes that change the height map will influence particles that later may follow a similar path. Thus commonly used paths will be eroded, reducing their height gradually. In figure 4, we can see the process after around 20 seconds of simulation. Notice that deep eroded paths can be found moving from areas of high elevation to areas of low elevation. Also notice that initially there was a large black split running through the middle of the map, representing some canyon, or a large river. The process of erosion has deposited material in this space, raising its height significantly.
The simulation time could be considered significant if this technique was to be embedded in a games level generator, but the results seem initially very encouraging. There are many parameters to play with however, each giving different results, so much more experimentation in this regard needs to be done. Another technique that needs to be explored to compliment this work is a method to detect which regions of the map should be submerged by water. After all, this is not much use unless we can also have nicely animated water in the correct places.
Figure 1.
The height map used in the demonstration.
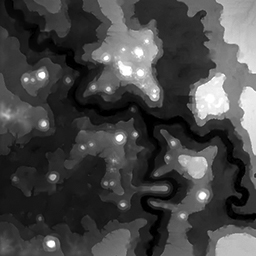
Figure 2.
A normal map generated from the above height map, demonstrating a method of determining the gradient by taking the vector cross product of tangent and binormal vectors.
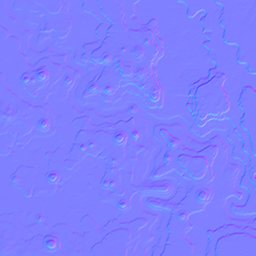
Figure 3.
Visualization of the particles in action. Particles shown in red are moving fast enough to lift material from the terrain.
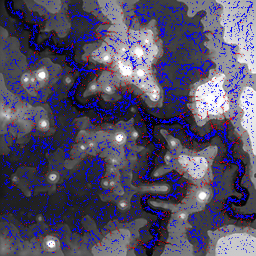
Figure 4.
The resulting simulation of crude erosion of the height map after around 20 seconds in the simulator. Notice the deposit of material that begins to fill up the lowest points in the map.
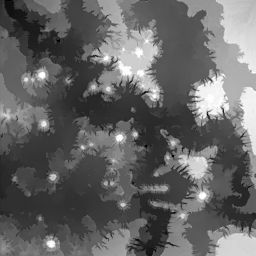
Figure 5.
Here the erosion model is applied to a smooth gradient to observe the effect of many random particles all moving together to create successively larger channels the deeper down the surface they run.

